Published July 24, 2026 · Updated August 19, 2026 by Nolan Webb · 11 min read · 691 views
Test Tube Setup And Methodology A probe was placed inside each of 3 test tube setups (TJL Sponge Tube, Cotton Tube, TJL Incubator Sponge Tube), to read what a queen or colony would actually be sitting in, with ant room (ambient) logged separately for reference. Data was collected May 29 to Jul 21, with a data point taken every minute. TJL Incubator Sponge Tube is the same design as TJL Sponge Tube, inside a makeshift styrofoam incubator.
Relevant Information:
Relative Humidity (RH). How close the air is to holding all the moisture it can at its current temperature. 100% is fully-saturated while 0% is completely unsaturated.
VPD (kPa). How hard the air pulls moisture out of the environment. It combines temperature and humidity into one number, which is why it is more useful. Lower is gentler; 0 would be fully-saturated air.
Ideal Humidity (90–100%) and Ideal VPD (<0.30kPa). The ideal hypothetical RH for most soil-nesting species is (90-100%). The ideal hypothetical for VPD is (0.30kPa) or lower. While it will depend on the exact species, most soil-nesting ants want it quite humid.
Why VPD And Not Just RH? Warm air holds more moisture, so the same humidity reading means a stronger drying-pull at warmer temperatures. VPD accounts for this. It is the drying-pull that the ants are actually exposed to.
Summary Nothing stayed under the ideal hypothetical of 0.30 kPa for the whole 53 days. The TJL Sponge Test Tube was closest at 0.188kPa on average. Moisture leaves the TJL Sponge Tube about 70% more slowly than the Cotton Tube. The Cotton Tube sat at 0.618kPa average, with a range of 81.6–86.0% RH, which is better for dry-loving species.
Summary per setup
TJL Sponge Tube
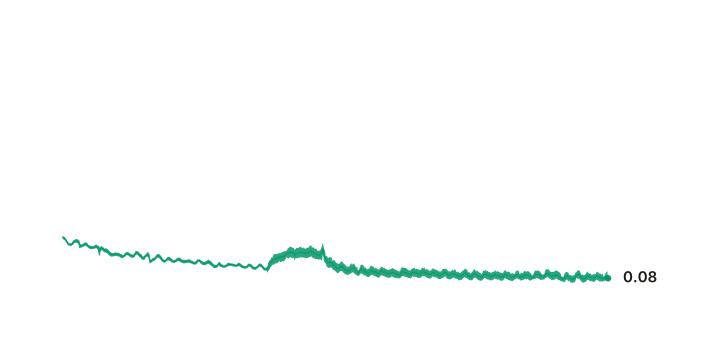
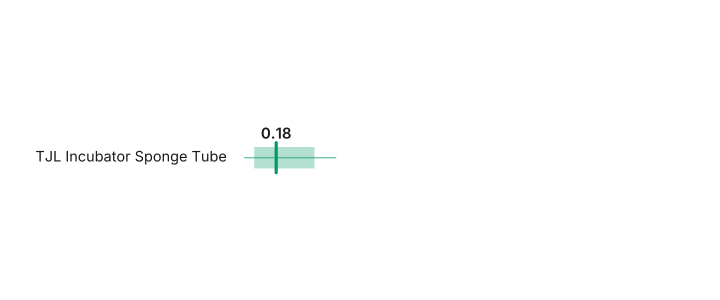
0.188kPa VPD
average drying pull · most readings within ±0.050
Last 14 d0.137 kPa
VPD range0.092–0.367
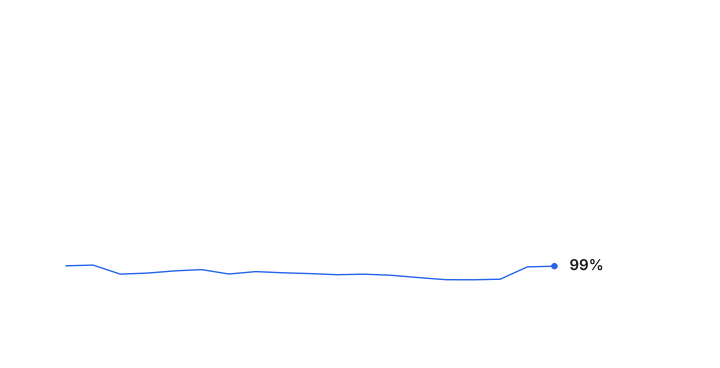
Holds VPD99%
Mean RH95.1%
Mean temp28.4°C
Cotton Tube
0.618kPa VPD
average drying pull · most readings within ±0.041
Last 14 d0.586 kPa
VPD range0.493–0.773
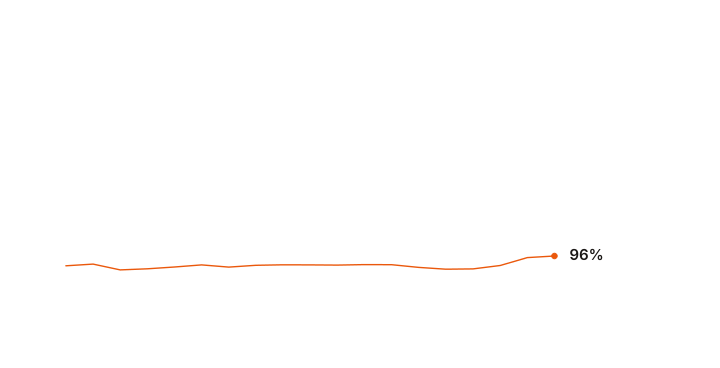
Holds VPD96%
Mean RH84.0%
Mean temp28.4°C
TJL Incubator Sponge Tube
0.190kPa VPD
average drying pull · most readings within ±0.098
Last 14 d0.096 kPa
VPD range0.017–0.485
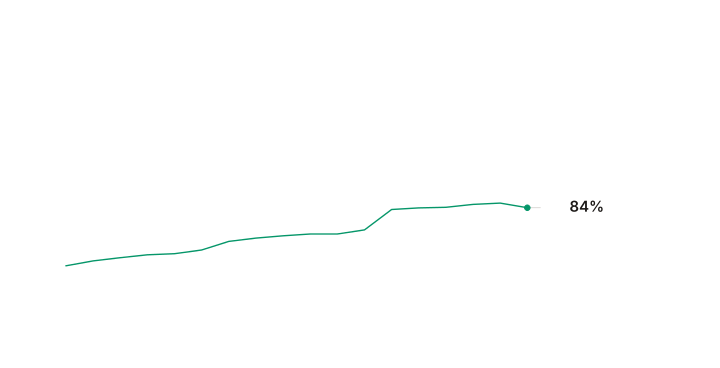
Holds VPD84%
Mean RH95.9%
Mean temp31.1°C
Ant Room (ambient)
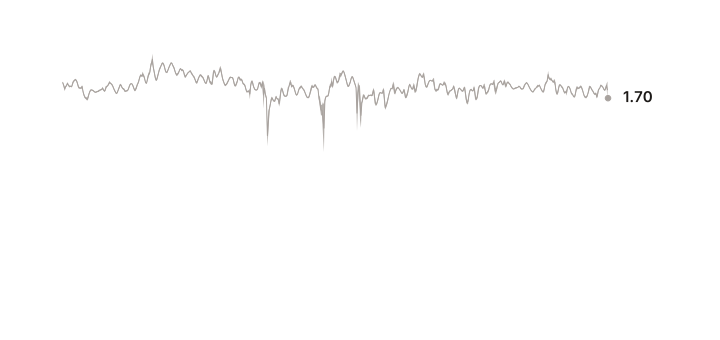
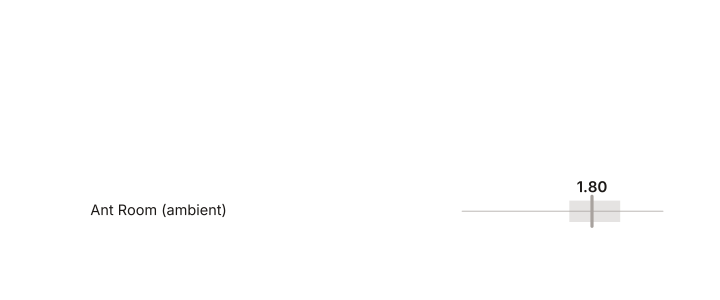
1.807kPa VPD
average drying pull · most readings within ±0.082
Last 14 d1.791 kPa
VPD range1.136–2.167
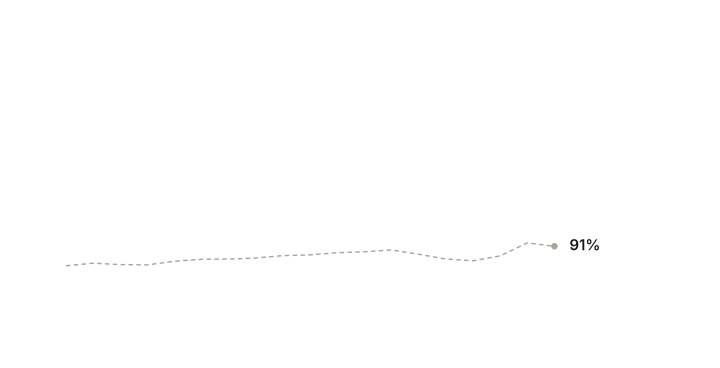
Holds VPD91%
Mean RH52.7%
Mean temp28.2°C
Moisture & Desiccation Risk How much time ants inside each setup would have been in our ideal hypothetical range (90-100% RH and VPD < 0.30kPa).
Moisture and desiccation risk
TJL Sponge Tube
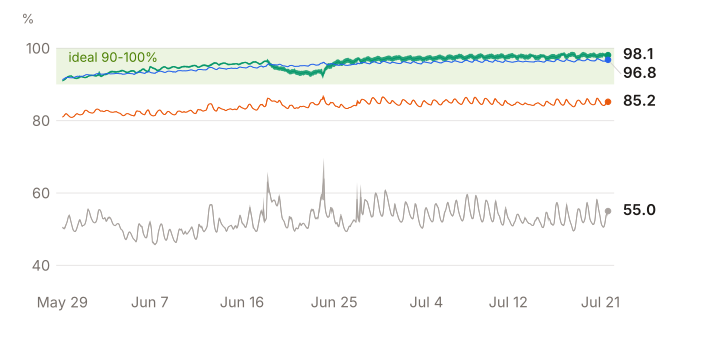
holds 92.6–96.7% very steadily
Time ants would be in safe humidity100.0%1278.6 h of 1279 h
Time above your drying limit2.1%26.8 h of 1279 h
100 episodes, the longest 9.3 h, the most recent ending 2026-06-07 18:55.
✓ Excellent
last 14 d vs prev 14 d: ▲ +0.53%
Cotton Tube
the conventional method
holds 81.6–86.0% very steadily
Time ants would be in safe humidity0.0%0.0 h of 1279 h
Time above your drying limit100.0%1278.6 h of 1279 h
One continuous episode of 1278.6 h, ending 2026-07-21 18:15.
✕ Poor
last 14 d vs prev 14 d: → 0.00%
TJL Incubator Sponge Tube
same design as TJL Sponge Tube, inside a makeshift incubator
holds 92.2–98.5% steadily
Time ants would be in safe humidity100.0%1278.6 h of 1279 h
Time above your drying limit15.0%191.2 h of 1279 h
355 episodes, the longest 86.4 h, the most recent ending 2026-06-24 17:36.
✓ Excellent
last 14 d vs prev 14 d: ▲ +0.95%
Ant Room (ambient)
holds 47.1–57.8% with a wide swing
Time ants would be in safe humidity0.0%0.0 h of 1279 h
Time above your drying limit100.0%1278.6 h of 1279 h
One continuous episode of 1278.6 h, ending 2026-07-21 18:15.
Reference
last 14 d not graded
A Low Grade Is Not Inherently Bad. It only measures how well a tube aligns with the ideal hypothetical. Values outside our ideal hypothetical are usable, and sometimes the ideal condition, those setups should just be intended for dry-loving species.
Above the ideal hypothetical for VPD < 0.30. Share of the log the drying-pull sat above the ideal hypothetical. Ants and especially their brood lose water through their cuticle, so the pull is what decides how fast our ants lose moisture.
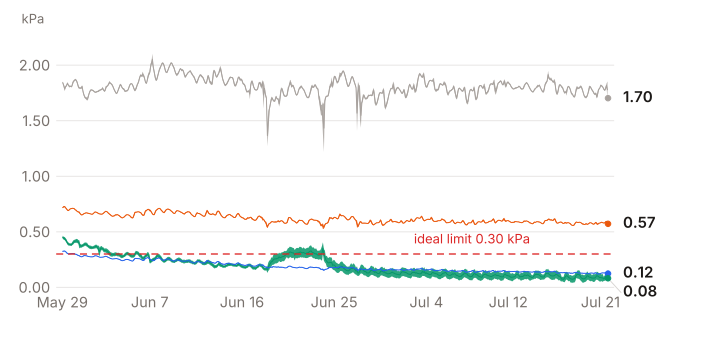
Vapor Pressure Deficit Over Time VPD combines temperature and humidity into a single measure of how quickly water evaporates in that air, the water within ants included. Lower is gentler. The dashed line marks the ideal hypothetical limit, so time spent above it is time an occupant would have been within the ideal hypothetical.
Ant Room (ambient) 1.807 kPa average, 1.136–2.167 range, 52.7% mean RH
The lower, the better.
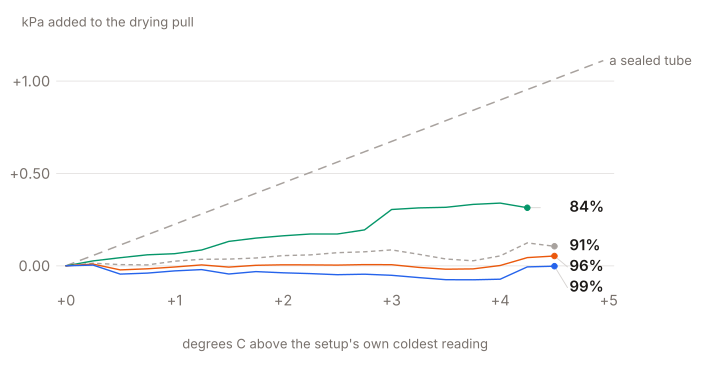
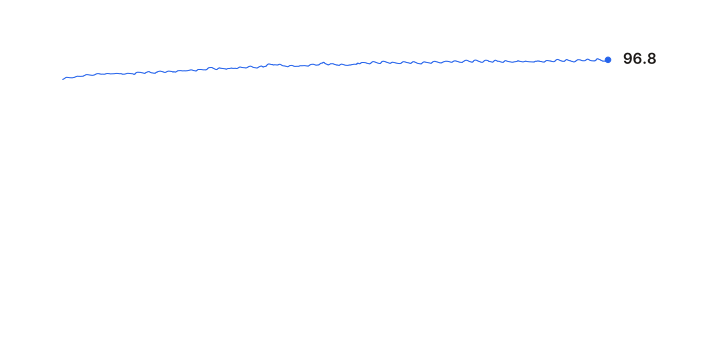
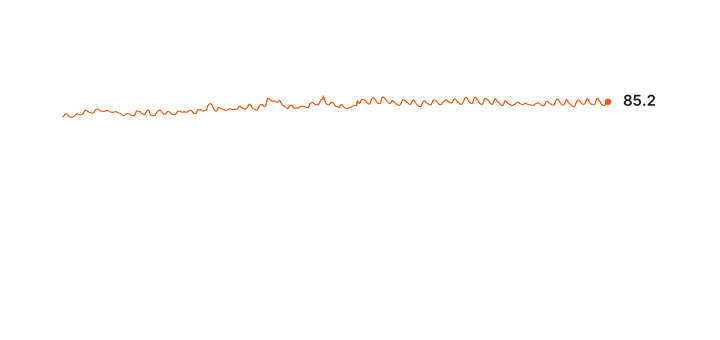
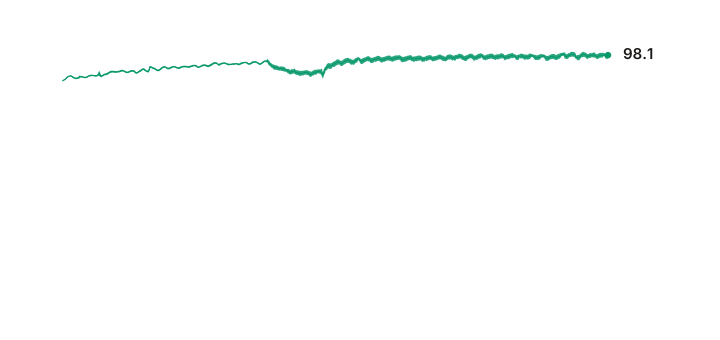
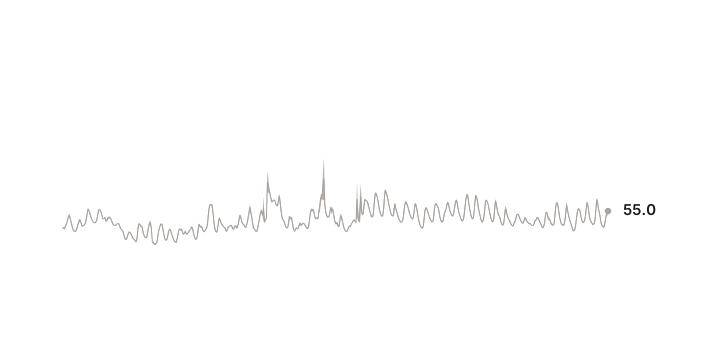
How Well Each Setup Holds VPD Against Temperature If the temperature of the air increases, its saturation point climbs, so the evaporation rate climbs with it, by roughly 0.22 kPa for every degree at 28 C. The dashed-curve represents a sealed tube exchanging no water with the air inside. Each trace starts at its own coldest reading, so setups sitting at different temperatures can still be compared by shape, and ends at a dot marking the warmest that setup ever got. The slope itself is measured within each day, so a sponge slowly saturating over weeks is never mistaken for a reaction to the room warming.
Ant Room (ambient) 1.807 kPa average, 1.136–2.167 range, 52.7% mean RH
The flatter, the better.
Holding VPD Against Temperature. Warm the air without adding water and its saturation point climbs, so the drying-pull climbs with it: about 0.22 kPa for every degree at 28 C. A setup with a wet plug can fight that, because warming makes the plug evaporate faster too. This figure is how much of the swing it cancelled. 100% is a setup whose drying-pull does not move with temperature at all; 0% is one behaving like a sealed jar of air; above 100% means the plug outran the warming and the pull actually eased as it got hotter. It matters because it says what a hot afternoon will do to a setup that looks fine today.
Relative Humidity Over Time The green band is the 90–100% humidity of our ideal hypothetical. The gap between a setup and that line is the humidity the setup itself is providing.
Ant Room (ambient) 1.807 kPa average, 1.136–2.167 range, 52.7% mean RH
The higher, the better.
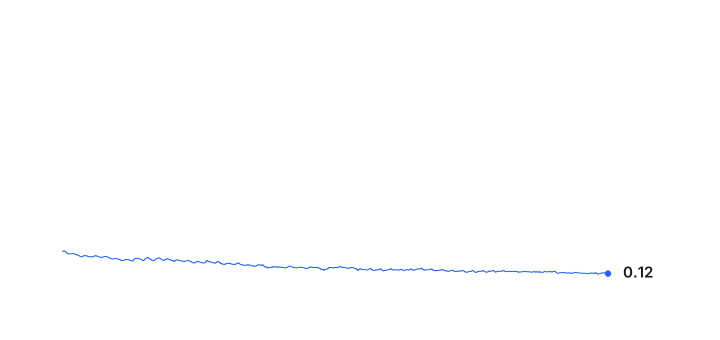
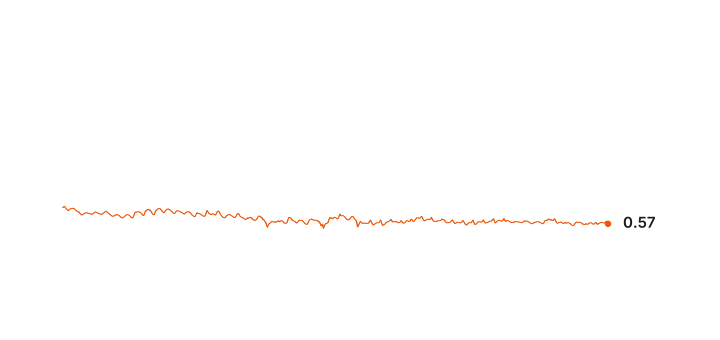
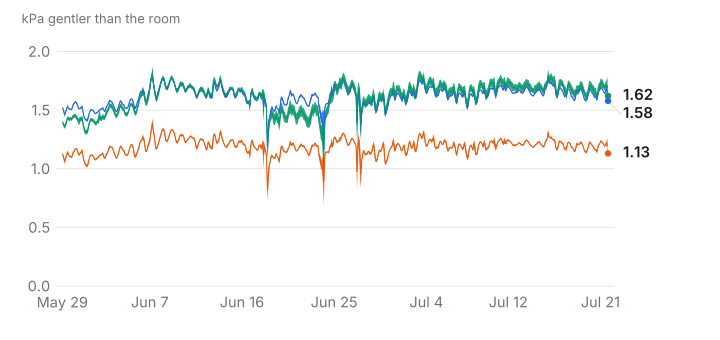
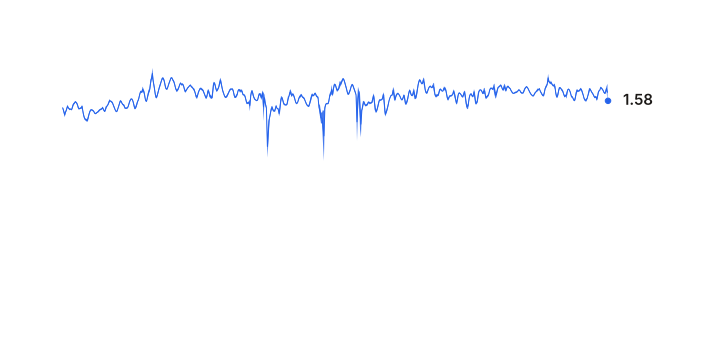
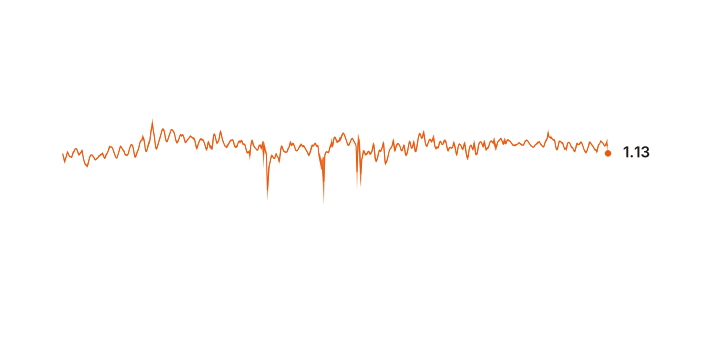
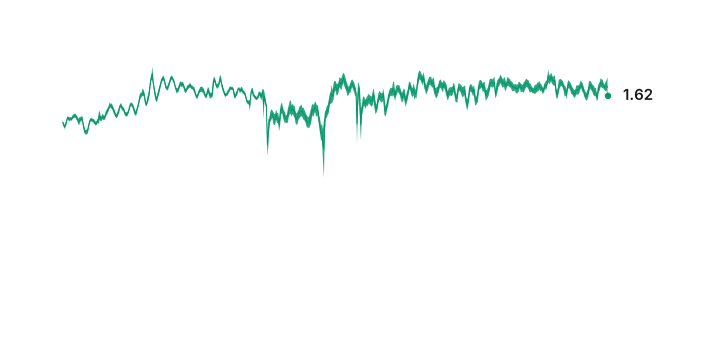
How Much Drying Force Each Setup Exerts The room's drying force minus each setup's. A reading of 1.6 means the air outside was pulling 1.6 kPa harder than the air inside. This is what the ants actually feel: a tube can sit far above the room on humidity and still offer little relief if it is warmer.
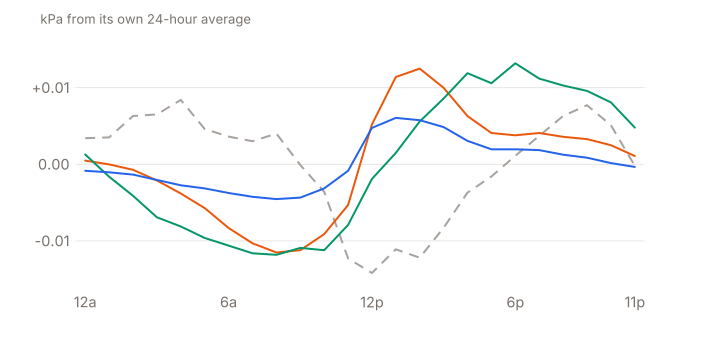
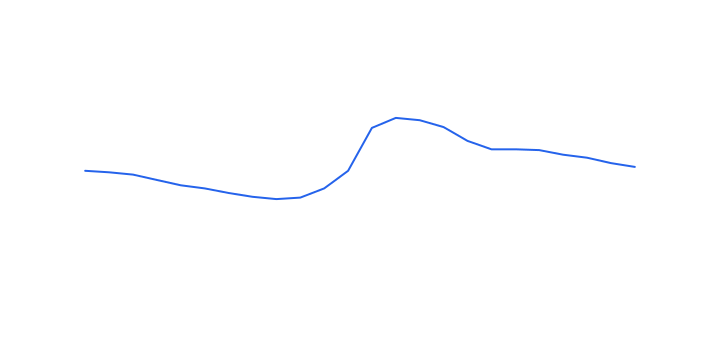
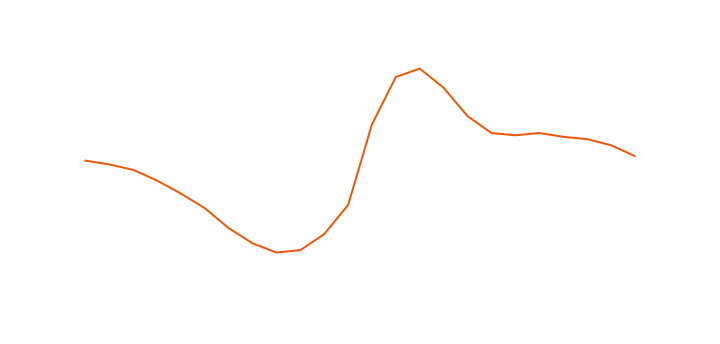
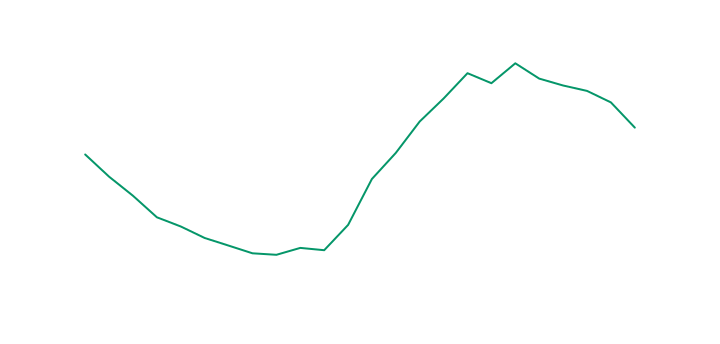
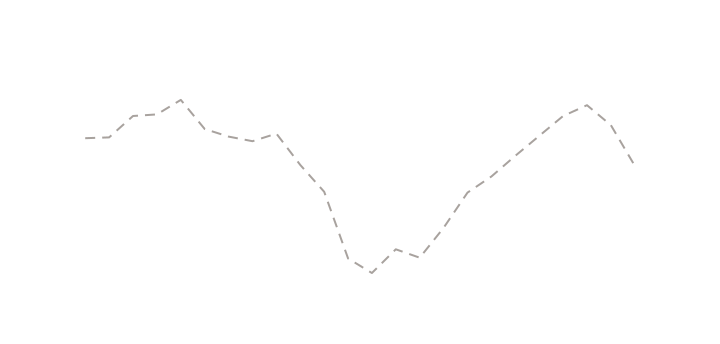
The Average Day A line that stays flat is counter-acting the daily cycle of ambient conditions. Each setup is plotted as how far its drying-pull drifts from its own 24-hour average, because on a shared VPD axis the room's swing dwarfs the tubes and flattens them into nothing.
Ant Room (ambient) 1.807 kPa average, 1.136–2.167 range, 52.7% mean RH
The flatter, the better.
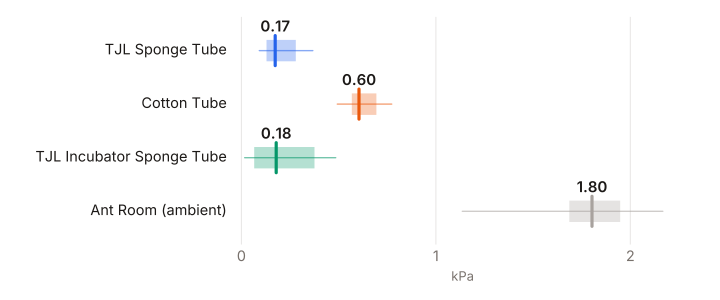
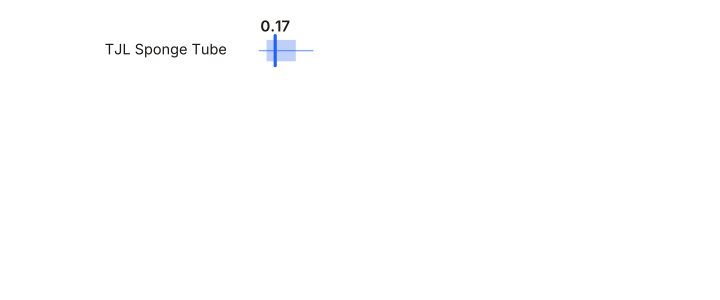
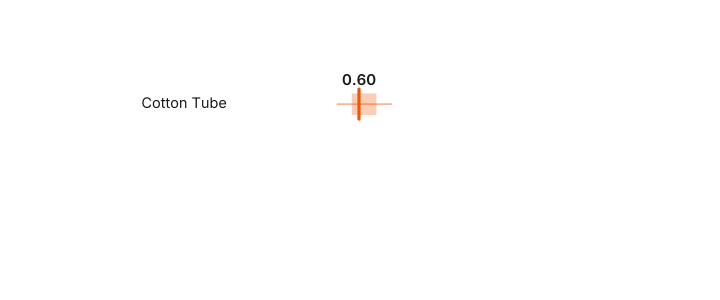
VPD Spread The thin line spans every reading from lowest to highest; the shaded block holds the middle 90% of them, and the upright tick is the median.
Ant Room (ambient) 1.807 kPa average, 1.136–2.167 range, 52.7% mean RH
The thinner, the better.
Conclusion Across 53 days, the TJL Sponge Tube came closest to the ideal hypothetical without quite meeting it. It held 92.6–96.7% RH, inside the 90–100% band the entire time, at 0.188 kPa on average. Its drying-pull did cross the 0.30 kPa line, for 26.8 hours out of 1,279, or 2.1% of the log. Nothing we tested stayed under that line the whole way. It also holds its moisture as the room warms, canceling ~99% of the swing a sealed tube would show. The Cotton Tube holds 81.6–86.0% RH, conditions best suited to dry-loving species.
How would you rate this?
One click is enough. Signed in, we show your first name; otherwise “Guest”.