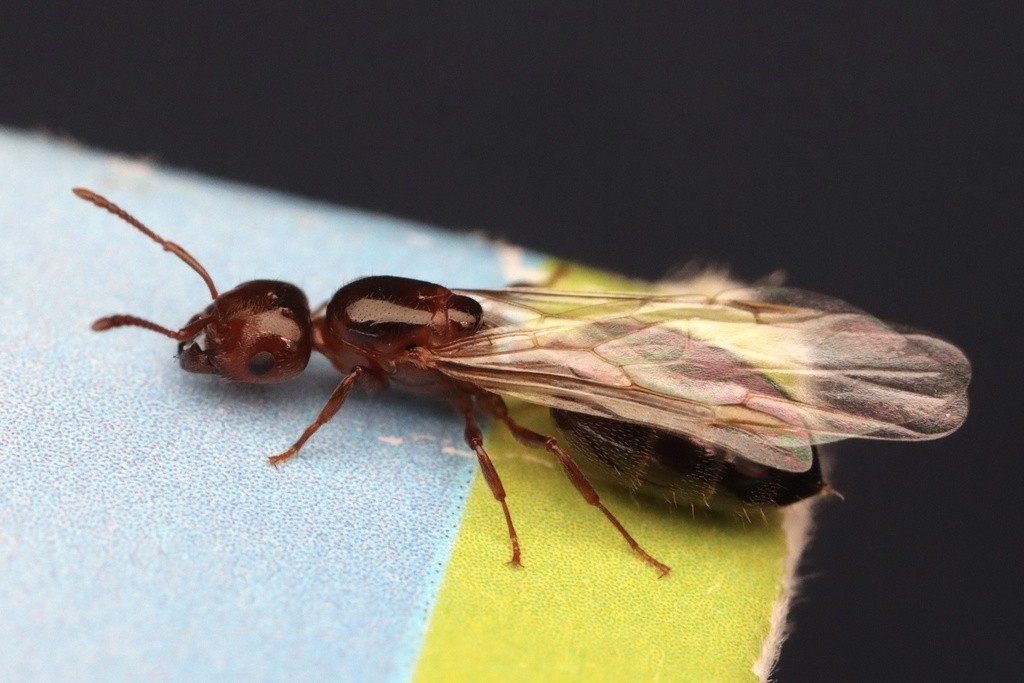
Southeastern US Ant Nuptial Flights
Nuptial flight records for the far southeastern United States, kept by a group of Florida ant-keepers and pooled into a single chart.
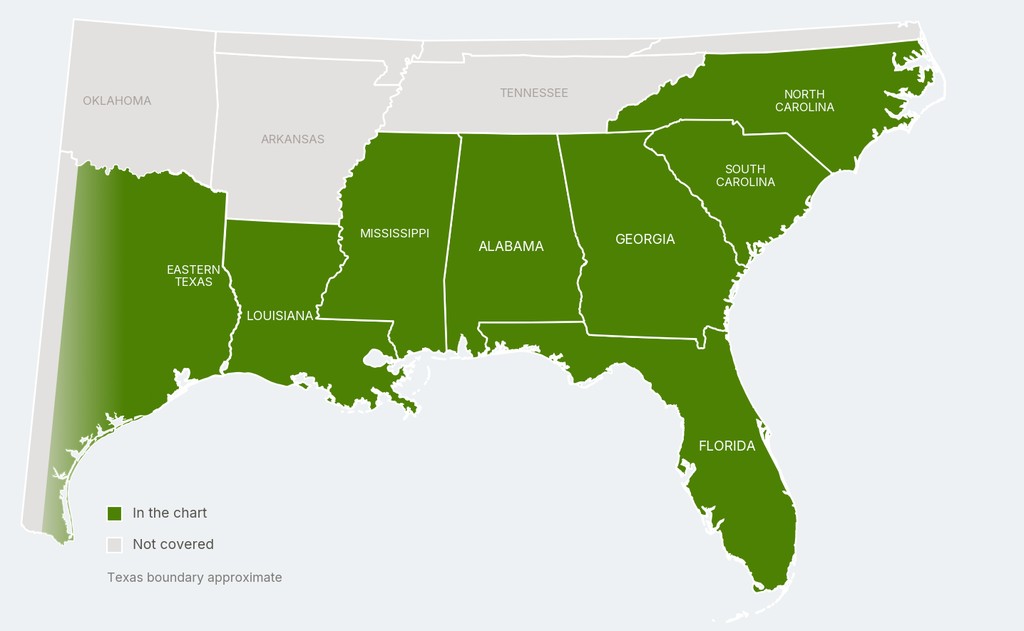
7,620 observations across 161 species, spanning Alabama, Florida, Georgia, Louisiana, Mississippi, North Carolina, South Carolina and eastern Texas.
How to read this
Each record is one day that somebody observed queens or males of a given species.
Not one queen. One day. Ten Camponotus castaneus queens on a single May evening is one record, not ten. The exception is a day so heavy that logging it as a single point would be dishonest, and spring Solenopsis invicta flights do this every year. Those get counted as several.
So the numbers tell you when to go out, not how many queens you will come home with.
The season
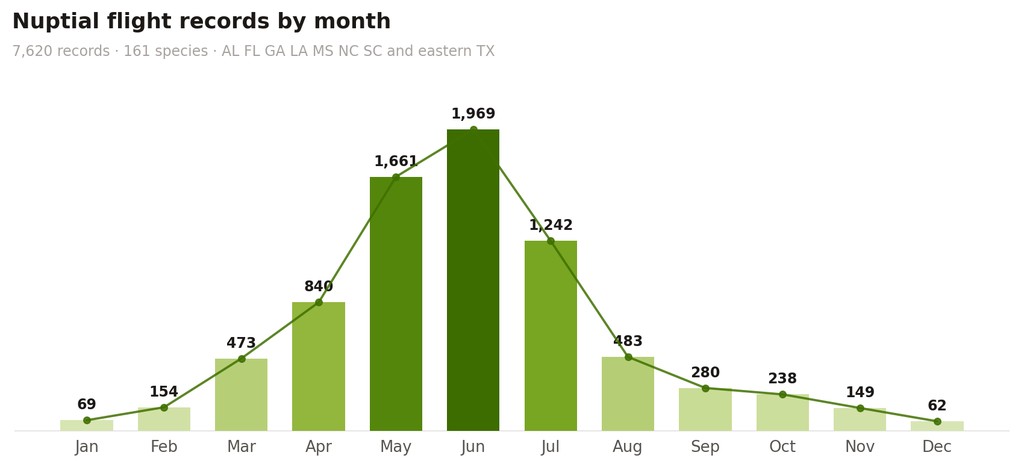
June, May and July hold 64% of the chart. December and January together hold under 2%.
Who flies when
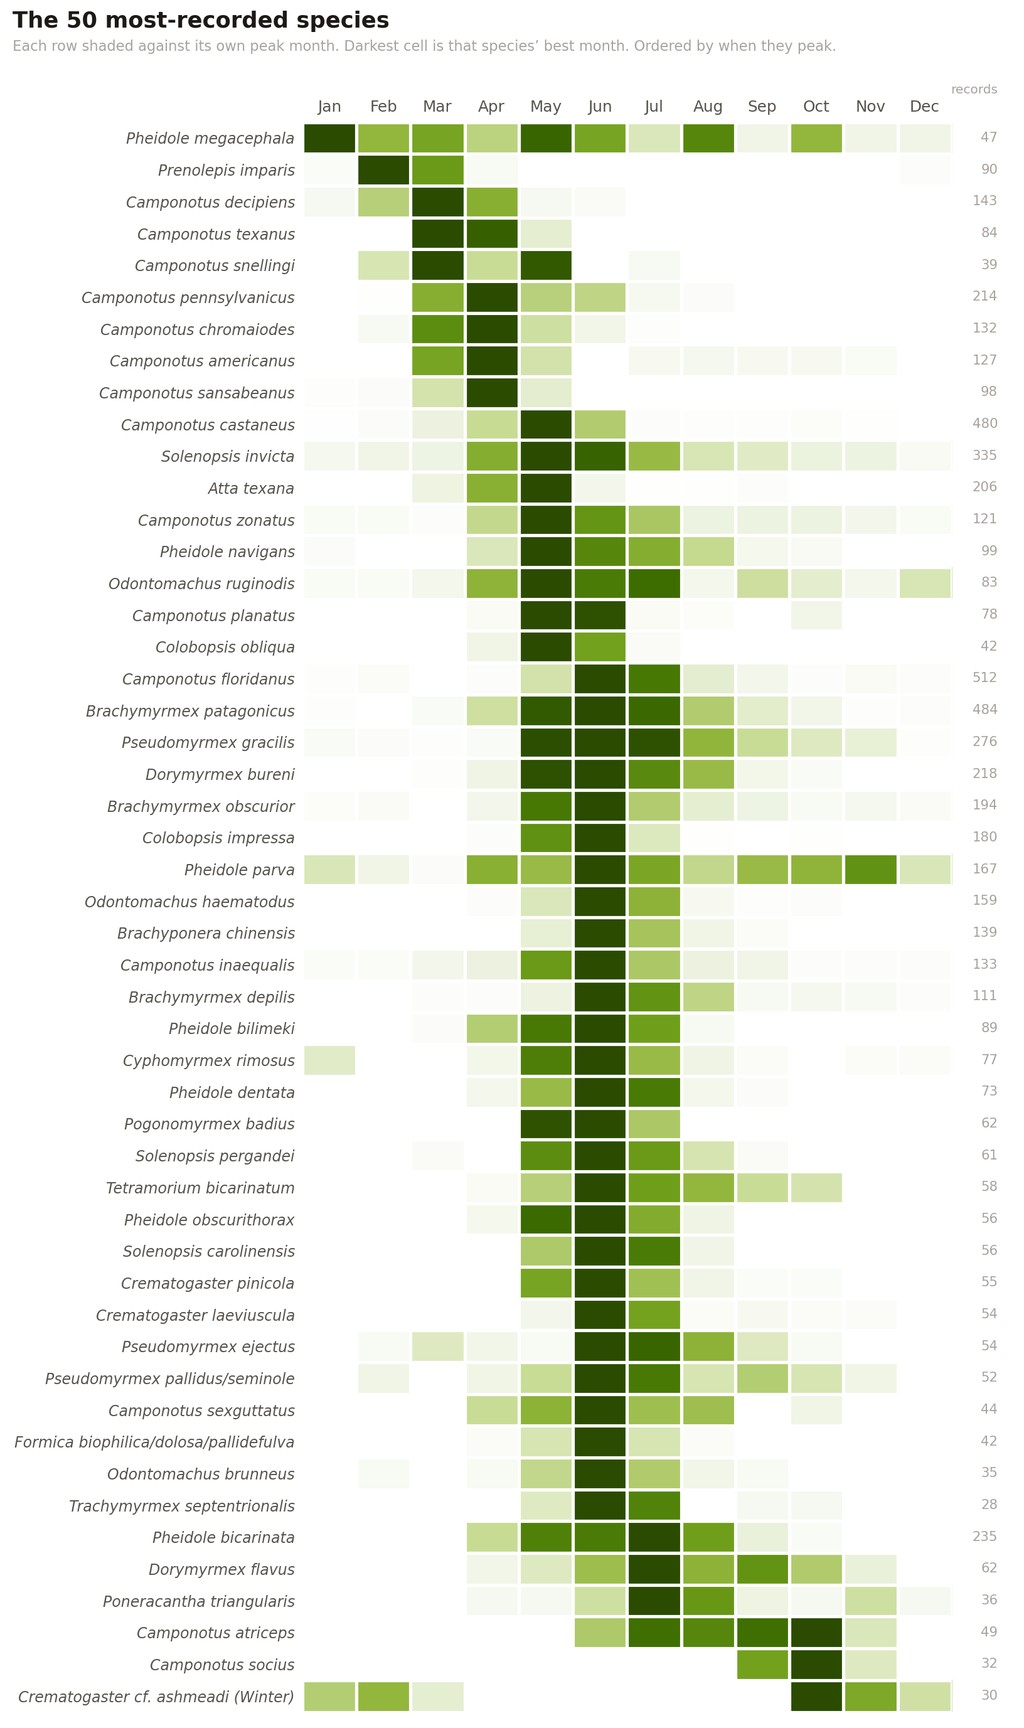
Read this one across, not down.
Each row is shaded against that species' own best month, so a common ant and a scarce one sit on the same footing. The diagonal running down the page is the season itself, from Pheidole megacephala in January to the winter brood of Crematogaster cf. ashmeadi in October.
When they fly
Time of day matters as much as month.
A June evening gets you Camponotus floridanus and nothing that flies at dawn. These groupings come from watching flights rather than from the literature, so treat them as working rules. Sixty-one species still have too few observations to place at all.
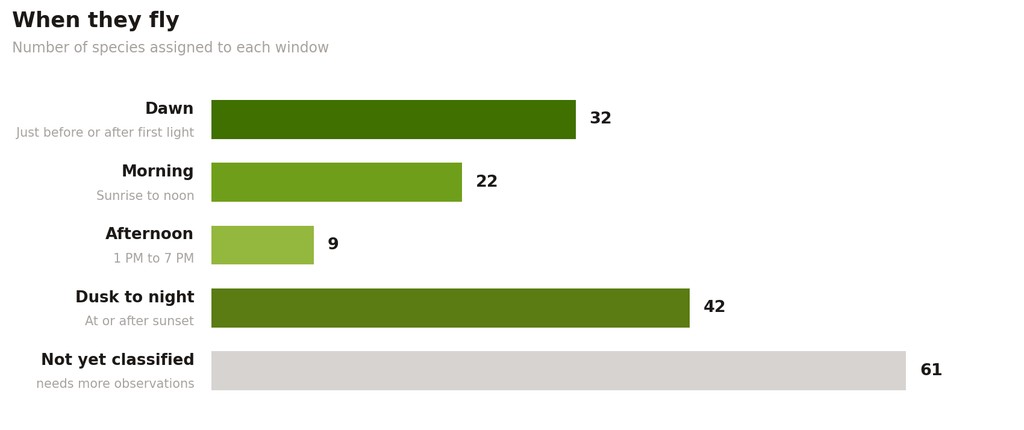
Half of every record on the chart belongs to a dusk or after-dark flier. In June it is 53%. Whatever else you do, go out at night.