Best PVA Test Tube Sponge For Ants? 5 Setups Tested
Nolan Webb
Published September 23, 2026 · 12 min read · 40 views
Our PVA Test Tube Sponges & Cotton Experiment compared our sponges against cotton. The obvious next question was how other test tube sponges hold up, so we added three of them and recorded for all five.
Test Tube Setup And Methodology
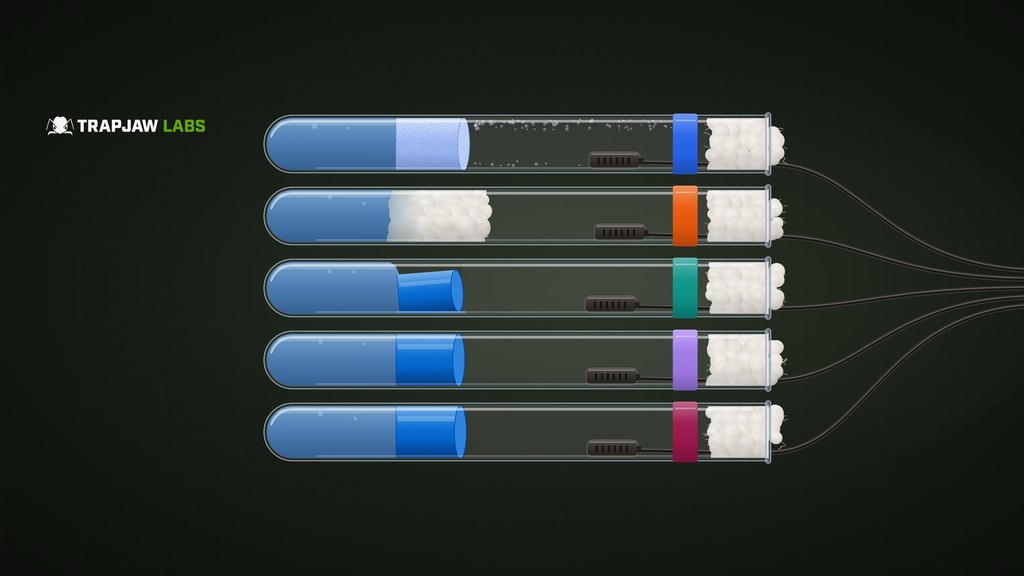
A probe was placed inside each of 5 test tube setups (TJL Sponge Tube, Cotton Tube, Amazon Sponge Tube, Vendor A Sponge Tube, Vendor B Sponge Tube), to read what a queen or colony would actually be sitting in, with the ant room (ambient) logged separately for reference. Data was collected Sep 12 to Sep 23, with a data point taken every minute.
The 5 tubes were set up on September 12th: TJL Sponge Tube, Cotton, a generic sponge bought on Amazon, and sponges sold by two other US ant-keeping vendors (Vendor A and Vendor B), which we've left unnamed.
Relevant Information
Relative Humidity (RH). How close the air is to holding all the moisture it can at its current temperature. 100% is fully-saturated while 0% is completely unsaturated.
VPD (kPa). How hard the air pulls moisture out of the environment. It combines temperature and humidity into one number, which is why it is more useful. Lower is gentler; 0 would be fully-saturated air. This effectively measures how quickly our ants are losing moisture, from their bodies, to the environment.
Ideal Humidity (90–100%) and Ideal VPD (<0.30 kPa). The ideal hypothetical RH for most soil-nesting species is 90–100%. The ideal hypothetical for VPD is 0.30 kPa or lower. While it will depend on the exact species, most soil-nesting ants want it quite humid. These are the same limits we used in our first experiment.
Why VPD And Not Just RH? Warm air holds more moisture, so the same humidity reading means a stronger drying-pull at warmer temperatures. VPD accounts for this. It is the drying-pull that the ants are actually exposed to.
Summary
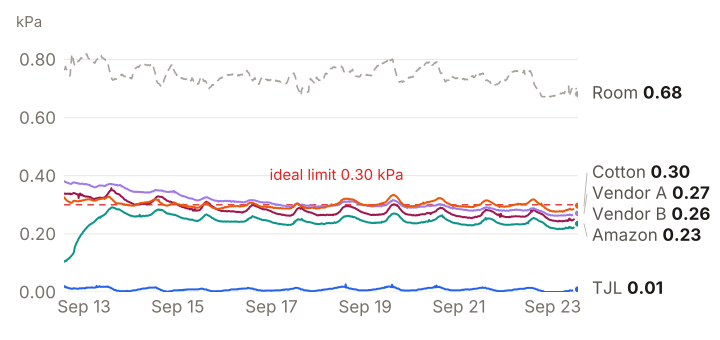
Two tubes stayed inside the ideal hypothetical for all 11 days: the TJL Sponge Tube and the Amazon Sponge Tube, but in very different ways. The TJL Sponge Tube held 99.4–99.9% RH at 0.009 kPa on average, about as close to fully-saturated air as the probe can read. The Amazon Sponge Tube held 91.2–92.8% RH at 0.243 kPa, just under the 0.30 kPa line. The two vendor sponges sat right alongside the Cotton Tube, at around 90% RH and 0.28–0.31 kPa.
Summary per setup
TJL Sponge Tube
0.009kPa VPD
average drying pull · most readings within ±0.005
VPD range0.000–0.047
Mean RH99.7%
Mean temp24.2°C
Cotton Tube
0.301kPa VPD
average drying pull · most readings within ±0.012
VPD range0.251–0.352
Mean RH90.0%
Mean temp24.2°C
Amazon Sponge Tube
0.243kPa VPD
average drying pull · most readings within ±0.025
VPD range0.080–0.293
Mean RH91.9%
Mean temp24.2°C
Vendor A Sponge Tube
0.310kPa VPD
average drying pull · most readings within ±0.030
VPD range0.253–0.384
Mean RH89.7%
Mean temp24.2°C
Vendor B Sponge Tube
0.284kPa VPD
average drying pull · most readings within ±0.025
VPD range0.219–0.384
Mean RH90.6%
Mean temp24.2°C
Ant Room (ambient)
0.743kPa VPD
average drying pull · most readings within ±0.032
VPD range0.535–0.824
Mean RH75.0%
Mean temp23.9°C
Moisture & Desiccation Risk
How much time ants inside each setup would have been in our ideal hypothetical range. The first card uses the standard limits from our first experiment (90–100% RH and VPD < 0.30 kPa). The second uses a stricter ideal (92–100% RH and VPD < 0.20 kPa).
Moisture and desiccation risk
Standard ideal: 90–100% RH and VPD under 0.30 kPa
TJL Sponge Tube
holds 99.4–99.9% very steadily
Time ants would be in the ideal humidity100.0%262.6 h of 262.6 h
Time ants would be in the ideal VPD100.0%262.6 h of 262.6 h
Never went above 0.30 kPa.
✓ Excellent
11-day window
Cotton Tube
the conventional method
holds 89.1–91.0% very steadily
Time ants would be in the ideal humidity56.3%148.2 h of 263.3 h
Time ants would be in the ideal VPD50.4%132.6 h of 263.3 h
Went above 0.30 kPa 251 times. The longest stretch lasted 18.5 h, and the most recent ended 2026-09-22 18:39.
! Moderate
11-day window
Amazon Sponge Tube
very loose in the tube
holds 91.2–92.8% very steadily
Time ants would be in the ideal humidity100.0%263.3 h of 263.3 h
Time ants would be in the ideal VPD100.0%263.3 h of 263.3 h
Never went above 0.30 kPa.
✓ Excellent
11-day window
Vendor A Sponge Tube
holds 88.0–90.9% while climbing
Time ants would be in the ideal humidity41.1%108.1 h of 263.3 h
Time ants would be in the ideal VPD48.1%126.6 h of 263.3 h
Went above 0.30 kPa 135 times. The longest stretch lasted 85.9 h, and the most recent ended 2026-09-22 02:20.
✕ Poor
11-day window
Vendor B Sponge Tube
holds 89.3–91.5% while climbing
Time ants would be in the ideal humidity86.7%228.3 h of 263.3 h
Time ants would be in the ideal VPD75.6%199.1 h of 263.3 h
Went above 0.30 kPa 72 times. The longest stretch lasted 29.1 h, and the most recent ended 2026-09-22 13:35.
! Moderate
11-day window
Moisture and desiccation risk
Stricter ideal: 92–100% RH and VPD under 0.20 kPa
TJL Sponge Tube
holds 99.4–99.9% very steadily
Time ants would be in the ideal humidity100.0%262.6 h of 262.6 h
Time ants would be in the ideal VPD100.0%262.6 h of 262.6 h
Never went above 0.20 kPa.
✓ Excellent
11-day window
Cotton Tube
the conventional method
holds 89.1–91.0% very steadily
Time ants would be in the ideal humidity0.0%0.0 h of 263.3 h
Time ants would be in the ideal VPD0.0%0.0 h of 263.3 h
Above 0.20 kPa for the whole window (263.3 h).
✕ Poor
11-day window
Amazon Sponge Tube
very loose in the tube
holds 91.2–92.8% very steadily
Time ants would be in the ideal humidity37.8%99.5 h of 263.3 h
Time ants would be in the ideal VPD3.5%9.1 h of 263.3 h
Went above 0.20 kPa twice. The longest stretch lasted 253.6 h, and the most recent is still running at the window end (2026-09-23 13:01).
✕ Poor
11-day window
Vendor A Sponge Tube
holds 88.0–90.9% while climbing
Time ants would be in the ideal humidity0.0%0.0 h of 263.3 h
Time ants would be in the ideal VPD0.0%0.0 h of 263.3 h
Above 0.20 kPa for the whole window (263.3 h).
✕ Poor
11-day window
Vendor B Sponge Tube
holds 89.3–91.5% while climbing
Time ants would be in the ideal humidity0.1%0.2 h of 263.3 h
Time ants would be in the ideal VPD0.0%0.0 h of 263.3 h
Above 0.20 kPa for the whole window (263.3 h).
✕ Poor
11-day window
Under the stricter ideal, only the TJL Sponge Tube stayed in range the whole time. The Amazon Sponge Tube was under 0.20 kPa for 3.5% of the window, and the other three never were.
A Low Rank Is Not Inherently Bad. It only measures how well a tube aligns with the ideal hypothetical. Values outside our ideal hypothetical are usable, and sometimes the ideal condition.
Within the ideal hypothetical for VPD. Share of the dataset the drying-pull sat within the ideal hypothetical (under 0.30 kPa on the standard card, 0.20 kPa on the stricter one). Ants and especially their brood lose water through their cuticle, so this is what decides how fast our ants lose moisture.
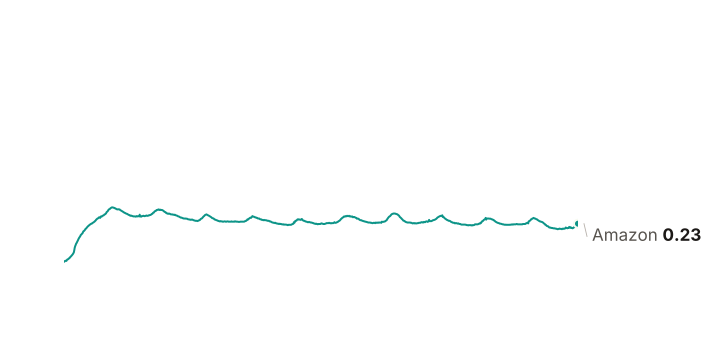
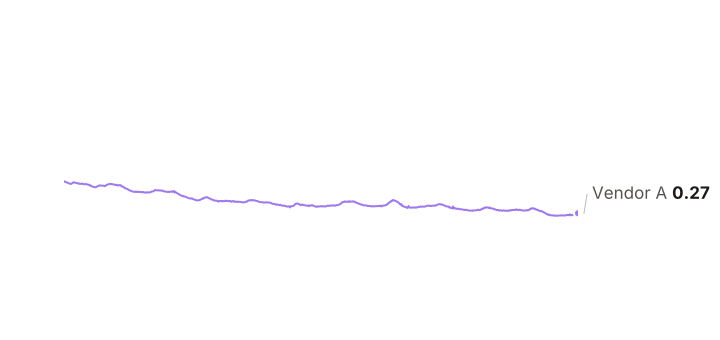
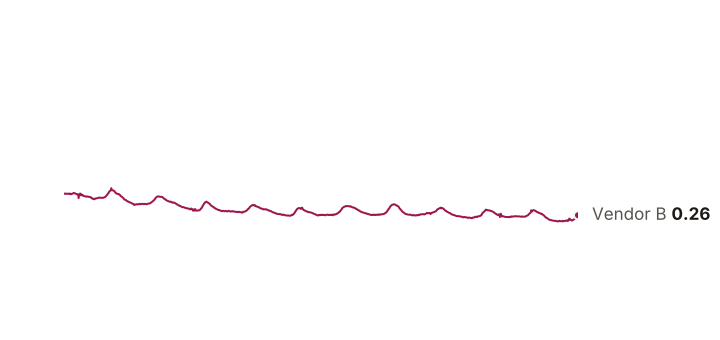
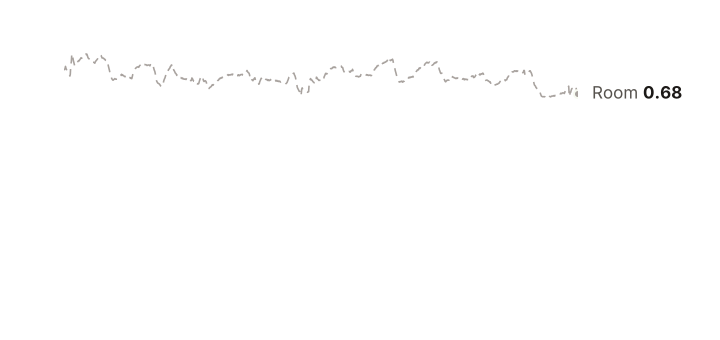
Vapor Pressure Deficit Over Time
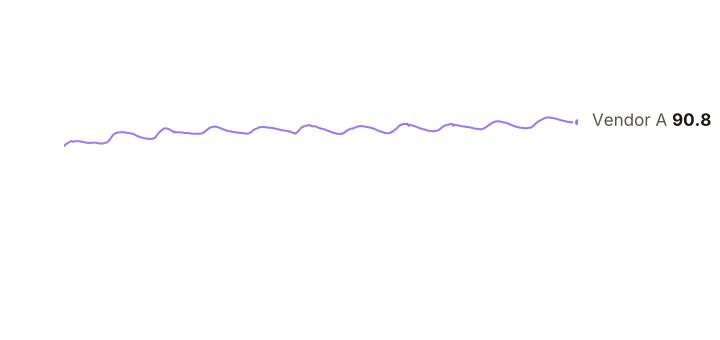
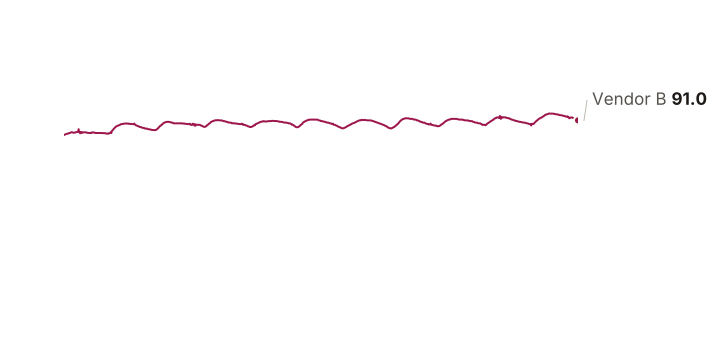
VPD combines temperature and humidity into a single measure of how quickly water evaporates in that air, the water within ants included. Lower is gentler. The dashed line marks the ideal hypothetical limit, so time spent above it is time an occupant would have been outside the ideal hypothetical.
Hover a line to bring it forward.
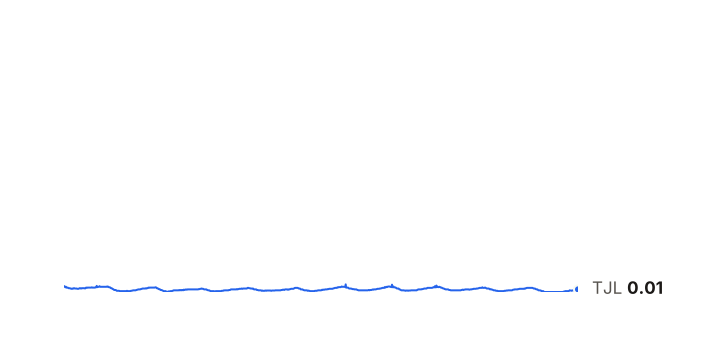
TJL Sponge Tube 0.009 kPa average, 0.000–0.047 range
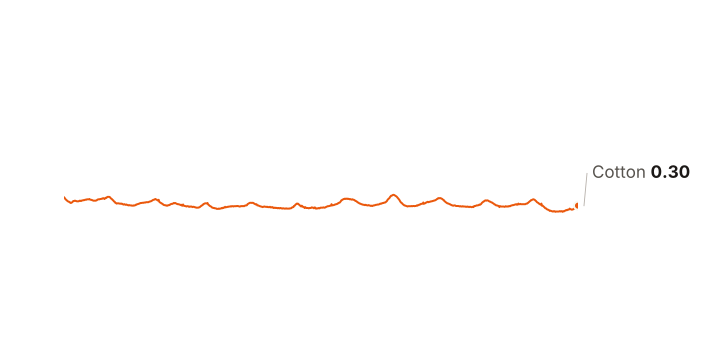
Cotton Tube 0.301 kPa average, 0.251–0.352 range
Amazon Sponge Tube 0.243 kPa average, 0.080–0.293 range
Vendor A Sponge Tube 0.310 kPa average, 0.253–0.384 range
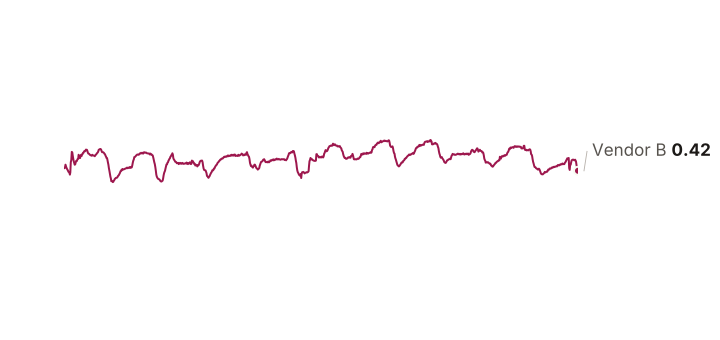
Vendor B Sponge Tube 0.284 kPa average, 0.219–0.384 range
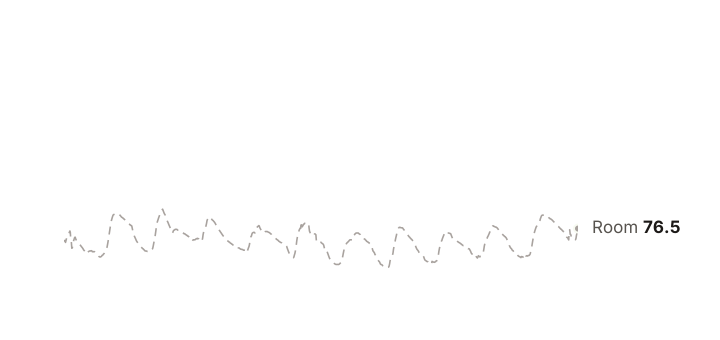
Ant Room (ambient) 0.743 kPa average, 0.535–0.824 range
The lower, the better.
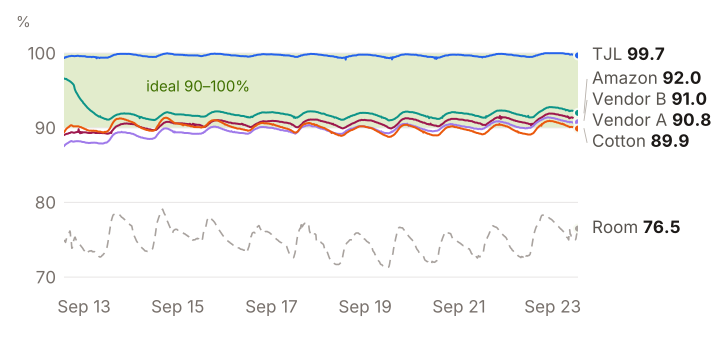
Relative Humidity Over Time
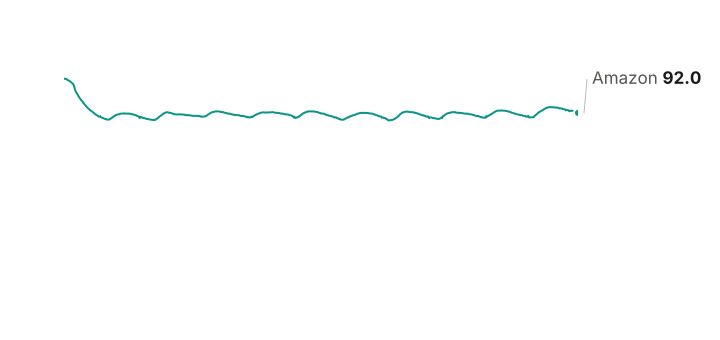
The green band is the 90–100% humidity of our ideal hypothetical. The dashed line is the room the tubes sit in, so the gap between a setup and that line is the humidity the setup itself is providing. The Amazon Sponge Tube started out more humid and settled over its first day.
Hover a line to bring it forward.
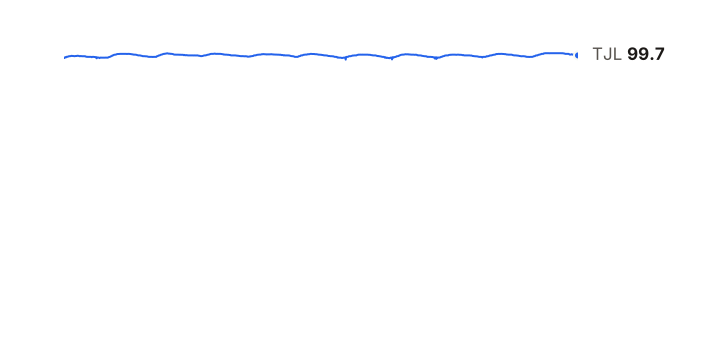
TJL Sponge Tube 99.7% mean RH, 99.4–99.9% most of the time
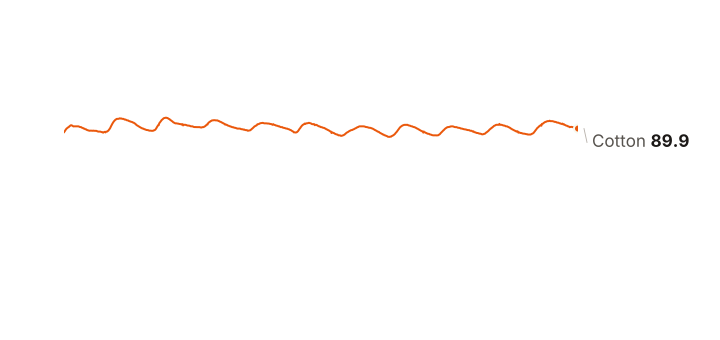
Cotton Tube 90.0% mean RH, 89.1–91.0% most of the time
Amazon Sponge Tube 91.9% mean RH, 91.2–92.8% most of the time
Vendor A Sponge Tube 89.7% mean RH, 88.0–90.9% most of the time
Vendor B Sponge Tube 90.6% mean RH, 89.3–91.5% most of the time
Ant Room (ambient) 75.0% mean RH, 72.1–78.0% most of the time
The higher, the better.
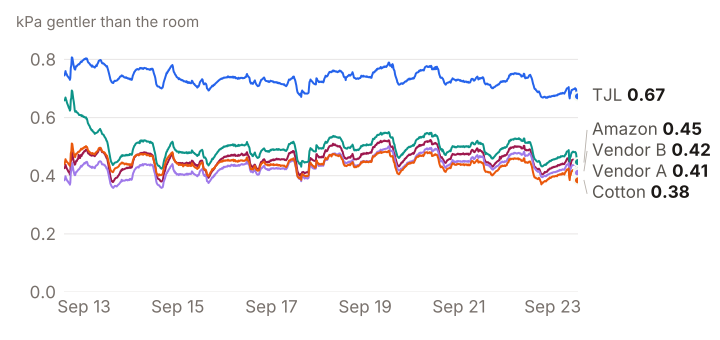
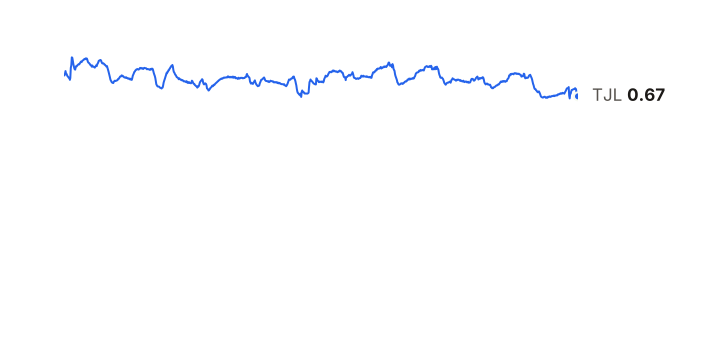
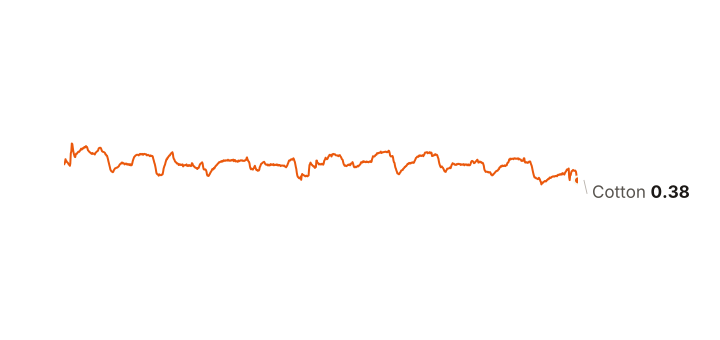
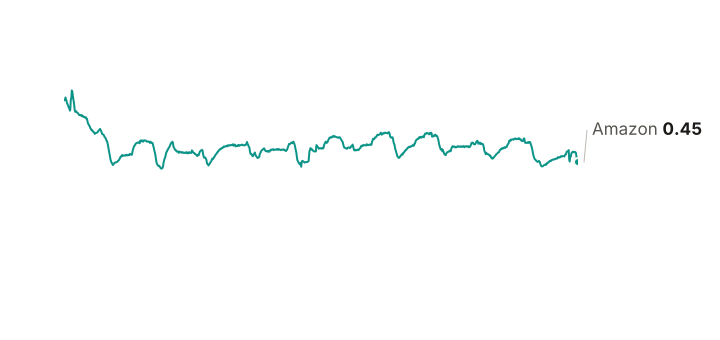
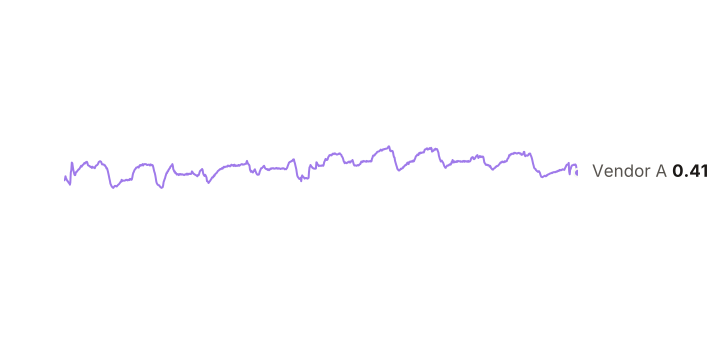
How Much Drying Force Each Setup Removes
The room's drying force minus each setup's. A reading of 0.7 means the air outside was pulling 0.7 kPa harder than the air inside. This is what the ants actually feel: a tube can sit far above the room on humidity and still offer little relief if it is warmer.
Hover a line to bring it forward.
TJL Sponge Tube 0.73 kPa gentler than the room on average
Cotton Tube 0.44 kPa gentler than the room on average
Amazon Sponge Tube 0.50 kPa gentler than the room on average
Vendor A Sponge Tube 0.43 kPa gentler than the room on average
Vendor B Sponge Tube 0.46 kPa gentler than the room on average
The higher, the better.
VPD Spread
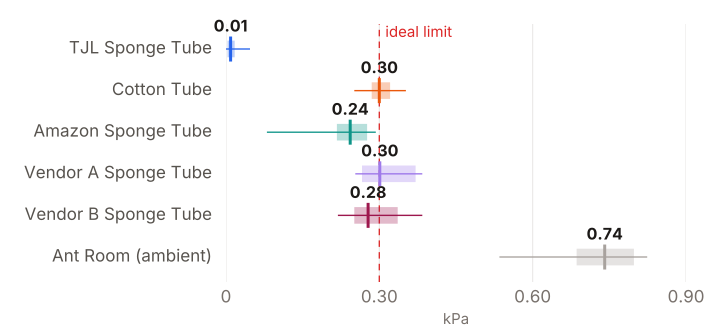
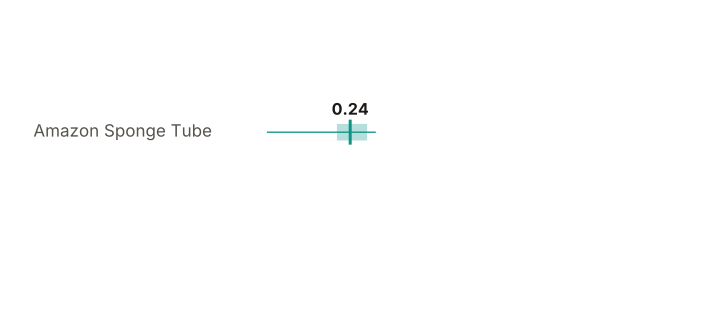
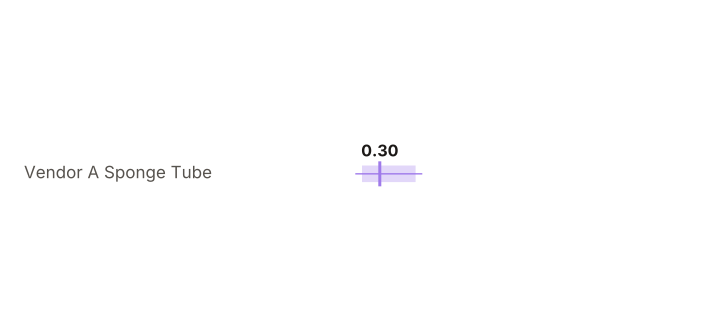
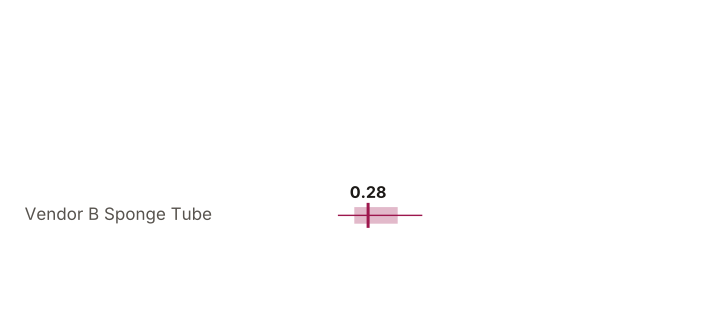
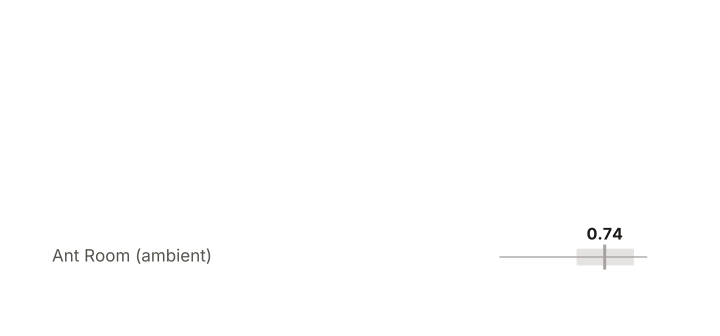
The thin line spans every reading from lowest to highest; the shaded block holds the middle 90% of them, and the upright tick is the median. The dashed line is the 0.30 kPa ideal limit.
Hover a row to bring it forward.
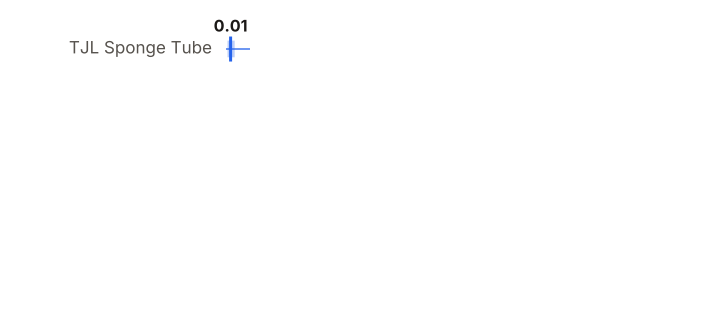
TJL Sponge Tube median 0.009 kPa, middle 90% 0.003–0.017
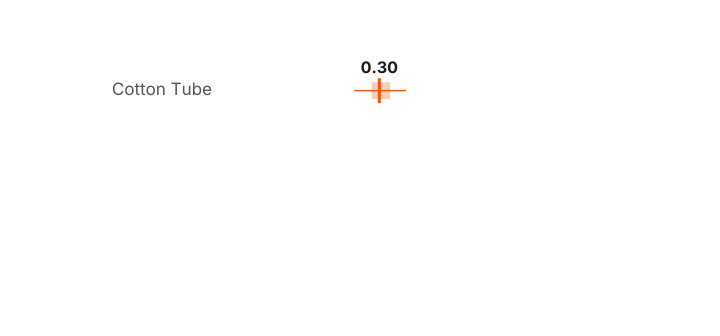
Cotton Tube median 0.300 kPa, middle 90% 0.285–0.321
Amazon Sponge Tube median 0.243 kPa, middle 90% 0.217–0.276
Vendor A Sponge Tube median 0.301 kPa, middle 90% 0.266–0.371
Vendor B Sponge Tube median 0.278 kPa, middle 90% 0.251–0.336
Ant Room (ambient) median 0.741 kPa, middle 90% 0.686–0.798
The thinner, the better.
Conclusion
Across 11 days, two tubes met the ideal hypothetical the whole time. The TJL Sponge Tube held 99.4–99.9% RH at 0.009 kPa on average, and never came close to the 0.30 kPa line. The Amazon Sponge Tube also stayed inside it, at 91.2–92.8% RH and 0.243 kPa, much closer to the line than to the TJL Sponge Tube. The two vendor sponges performed a lot like cotton, and all three hovered so close to 0.30 kPa that small differences decided which side of the line a reading landed on: Vendor A spent 48.1% of the window under 0.30 kPa, Vendor B 75.6%, and the Cotton Tube 50.4%. We'll keep taking data to see how, and if, things change over time!
If you keep species that want it humid, our Test Tube Sponges are as good as it gets.
How would you rate this?
One click is enough. Signed in, we show your first name; otherwise “Guest”.